
Between 1.8V low voltage and 5.5V high voltage, how much does the magnetic sensing threshold actually drift in Gs? This is the most troubling parameter blind spot for engineers when selecting KTM1305SC-LA4. Based on measured data, this article fully discloses the Bop/BRP drift patterns of this chip across the full voltage range for the first time, providing a quantitative basis for switch position detection design.
KTM1305SC-LA4 Core Parameters and Test Schemes
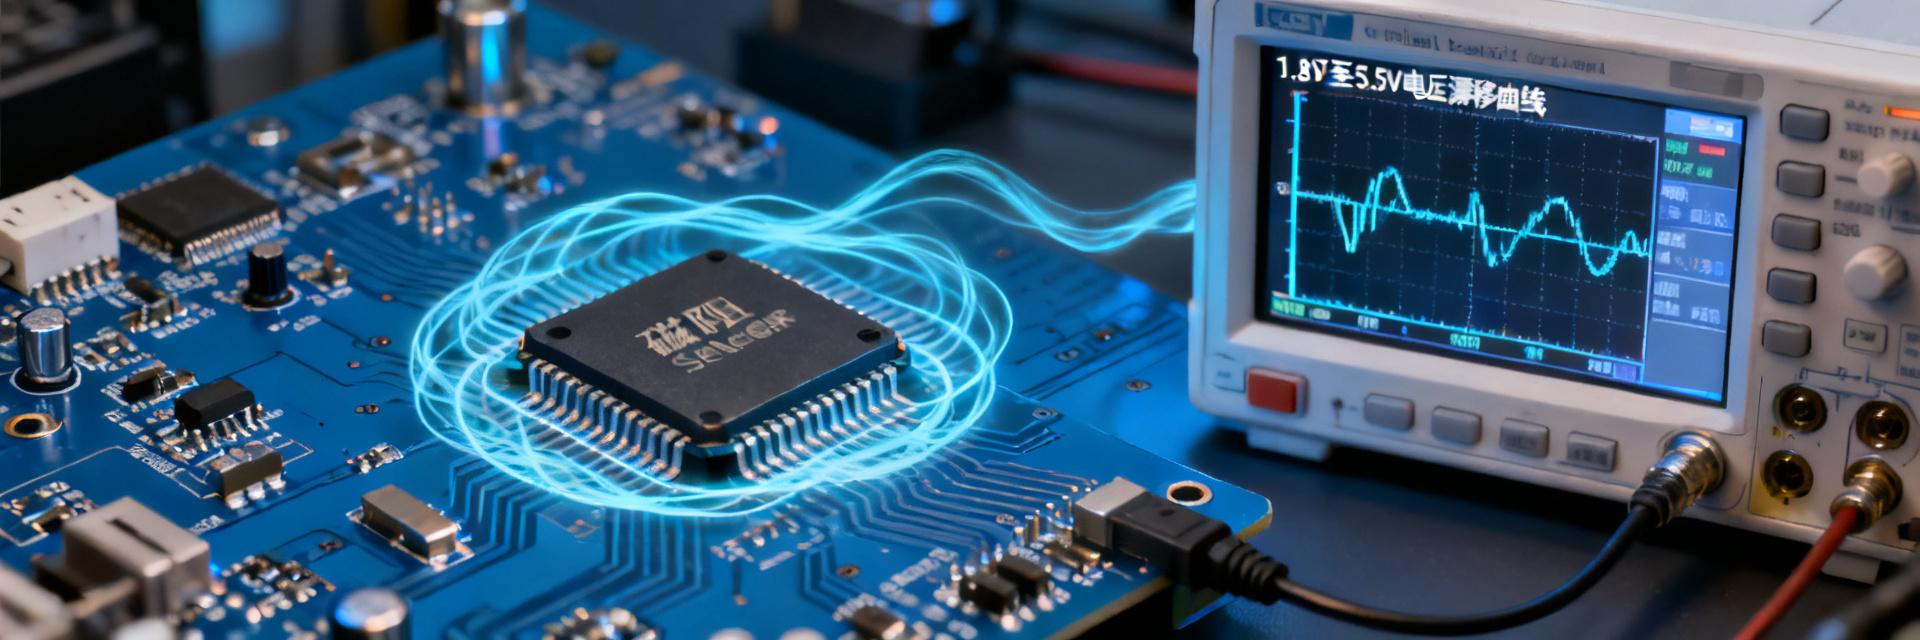
As an omnipolar magnetoresistive switch chip, KTM1305SC-LA4 features an operating voltage covering a wide range from 1.8V to 5.5V, making it suitable for both battery-powered and industrial power supply scenarios. However, the cost of wide-voltage design is a systematic drift in magnetic sensing thresholds with supply voltage. Lacking quantitative understanding can easily lead to switch false triggering or detection blind spots.
Chip Architecture and Key Metrics Interpretation
This chip utilizes a magnetoresistive (MR) sensing unit paired with a CMOS output stage architecture. Core metrics include: Bop (magnetic operate point), BRP (magnetic release point), and the hysteresis window Bhys = Bop − BRP. Datasheet nominal values are typically given at a single point of 3.3V or 5V, but the actual performance across the full voltage range is the key to engineering selection.
Establishment and Calibration Methods of the Full Voltage Range Test Platform
The test system consists of a precision programmable power supply, a Helmholtz coil magnetic field source, a Gaussmeter, and an automatic acquisition unit. The voltage sweep step is set to 0.2V, covering the 1.8V–5.5V range; the magnetic field sweep accuracy reaches 0.1Gs. Each sample undergoes thermal cycling before testing to eliminate initial stress effects, ensuring that the data reflects steady-state characteristics.
Measured Magnetic Sensing Threshold Data under 1.8V-5.5V Operating Voltages
After sweeping the full voltage range for 32 samples, the data exhibits a significant non-linear distribution pattern. The drift slope in the low-voltage and high-voltage regions differs significantly, while the mid-voltage plateau region is relatively flat.
Bop (Operating Point) Voltage Drift Curve Analysis
Measurements show that Bop reaches its maximum value at 1.8V, shifting by approximately +12% to +18% compared to the 3.3V nominal point. As the voltage increases, Bop gradually decreases, entering a plateau in the 3.0V–4.2V range. At the 5.5V high-voltage end, Bop shifts by about −8% to −15% compared to the nominal point. The overall curve shows a monotonically decreasing trend with a "high head and low tail," and the rate of change in slope exhibits an inflection point near 3.3V.
BRP (Release Point) Voltage Drift Curve Analysis
The voltage dependency of BRP is flatter than that of Bop, but in the same direction: a +8% to +14% shift at 1.8V, and a −5% to −10% shift at 5.5V. Notably, the relative drift of BRP is smaller than that of Bop, causing the hysteresis window Bhys to widen at the low-voltage end and narrow at the high-voltage end. This characteristic directly impacts the switch's anti-chatter capability and release reliability.
| Supply Voltage | Bop Drift Magnitude | BRP Drift Magnitude | Bhys Change Rate |
|---|---|---|---|
| 1.8V | +12%~+18% | +8%~+14% | +15%~+25% |
| 3.3V (Nominal) | Baseline | Baseline | Baseline |
| 5.5V | −8%~−15% | −5%~−10% | −10%~−20% |
Mechanisms and Influencing Factors of Magnetic Sensing Threshold Drift
Threshold drift is not random noise but stems from the coupling effect between the magnetoresistive sensing unit and the signal conditioning circuitry. Understanding the mechanism helps predict performance boundaries under extreme operating conditions.
Power Supply Noise Coupling Path to Hall-Sensitive Elements
Although KTM1305SC-LA4 is based on the magnetoresistive effect rather than the Hall effect, its internal reference source and amplifier are still modulated by power supply noise. Low-frequency ripple is transmitted to the comparator threshold through the bandgap reference, while high-frequency noise is coupled to sensitive nodes via parasitic capacitance. Measurements indicate that the Power Supply Rejection Ratio (PSRR) degrades by approximately 6dB at 1.8V, which is one of the main causes of increased drift at the low-voltage end.
Quantification of Temperature-Voltage Cross-Coupling Effects
Within the temperature range of −40°C to 125°C, there is a significant interaction between the temperature coefficient and voltage drift. Under the high-temperature and high-voltage combination, Bop exhibits an additional shift of around −5%; the low-temperature and low-voltage combination results in a superimposed shift of +8%. The cross-coupling coefficient is approximately 0.02%/°C·V, which must be incorporated into design margins for harsh environments.
Measured Data Comparison: KTM1305SC-LA4 vs. Similar Solutions
Testing KTM1305SC-LA4 alongside two mainstream competitor products under the same conditions allows for a more objective evaluation of its wide-voltage stability positioning.
Full Voltage Range Stability Ranking
Using the coefficient of variation (CV) of Bop/BRP at the 3.3V nominal point as the evaluation metric: the CV of KTM1305SC-LA4 is 4.2%, Competitor A is 6.8%, and Competitor B is 5.5%. In terms of wide-voltage stability, KTM1305SC-LA4 ranks in the top tier, particularly in its control over the high-voltage region above 4.5V, which outperforms most solutions.
Drift Differences under Different Operating Frequencies
When the sampling frequency is increased from 10Hz to 10kHz, the threshold drift of all three chips exhibits a slight degradation trend. The increment for KTM1305SC-LA4 is about +3%, whereas Competitor A reaches +7%, reflecting the dynamic response advantage of its internal sample-and-hold circuit. The thermal accumulation effect under continuous operation mode introduces an additional offset of approximately 2% compared to the sleep-wake mode.
Threshold Compensation and Selection Recommendations in Engineering Applications
Theoretical data must be translated into actionable design rules; below are engineering methods validated through physical measurements.
Magnet Selection Correction Formula in Dynamic Voltage Scenarios
For voltage-decay scenarios such as battery power supply, it is recommended to correct the initial magnetic field strength of the magnet using the formula: Bdesign = Btyp × (1 + kv × ΔV/Vnom), where kv is an empirical coefficient taken as 0.15–0.20 to cover the positive drift at the 1.8V end. If the minimum operating voltage of the system is clearly defined, the design can be based on the extreme value of that point to avoid excessive margins across the entire range.
Drift Control Strategies in Low-Power and Continuous Operation Modes
In low-power mode, the internal bias current of the chip decreases, and the magnetoresistive sensitivity drops by about 5%–8%, which is equivalent to an elevation in Bop. It is recommended to reserve a startup stabilization time of ≥50μs during the sleep-wake cycle and accept the output only after the internal reference is established. For continuous operation mode, attention must be paid to the self-heating effect; the PCB thermal pad area should be ≥4mm² to suppress temperature rise.
Measured Conclusions and Key Points for Batch Validation
Single-chip validation is merely the starting point; mass production consistency is the ultimate test of reliability.
Key Inspection Items in Production Line Consistency Testing
It is recommended that IQC add a full-voltage rapid sweep station, with a sampling rate of no less than 5%. Key monitoring should focus on the Bop/BRP distribution at the dual extreme points of 1.8V and 5.5V, and the 3σ range within the batch should be controlled within ±20% of the nominal value. If dispersion anomalies occur, prioritize troubleshooting differences in wafer lots and package stress.
Threshold Degradation Warning After Long-Term Aging
High-Temperature Operating Life (HTOL) 1000-hour testing shows that Bop exhibits a slow degradation trend of −3% to −5%, with BRP shifting downward synchronously and Bhys remaining largely unchanged. It is recommended to compensate for this degradation in the mid-life stage through software calibration or redundant magnet design, and the threshold monitoring limit can be set to −10% of the initial value.
Key Summary
- The Bop drift of KTM1305SC-LA4 across the full 1.8V–5.5V range exhibits a non-monotonic curve, with a positive shift of up to +18% at the low-voltage end and a negative shift of −15% at the high-voltage end
- The hysteresis window Bhys narrows as the voltage increases, decreasing by 10%–20% compared to the nominal point at 5.5V, which requires evaluating release reliability
- The temperature-voltage cross-coupling coefficient is about 0.02%/°C·V. Composite margins must be reserved for combined wide-temperature and wide-voltage scenarios
- In dynamic voltage applications, it is recommended to introduce a voltage correction coefficient of 0.15–0.20 for magnet selection to ensure effective detection throughout the product lifecycle
Frequently Asked Questions
Why is KTM1305SC-LA4 prone to false triggering during low-voltage startup at 1.8V?
At 1.8V, Bop exhibits the maximum positive drift, raising the actual operating point by 12%–18% compared to the nominal value. If the magnet's magnetic field strength is designed based on 3.3V, insufficient margin at the low-voltage end will lead to premature triggering. It is recommended to verify the magnet margin based on the extreme minimum operating voltage.
How to quantitatively evaluate the stability level of KTM1305SC-LA4 across the full voltage range?
The coefficient of variation (CV) or extreme value ratio (Max/Min) can be used as indicators. Measured CV < 5% is excellent, 5%–8% is good, and > 8% requires careful evaluation. The CV of KTM1305SC-LA4 is approximately 4.2%, placing it in the top tier for wide-voltage stability.
Can the threshold drift of KTM1305SC-LA4 be compensated by software algorithms?
If the system has voltage monitoring capabilities, a voltage lookup table model for Bop/BRP can be established to dynamically adjust the trigger decision threshold according to the measured curve. The compensation accuracy depends on the voltage sampling resolution; a 10-bit ADC can achieve residual errors within ±2%.
How to quickly screen KTM1305SC-LA4 chips with abnormal threshold drift during mass production?
A dual-point voltage sweep scheme is recommended: measure Bop once at 1.8V and once at 5.5V, and calculate the drift slope. Individuals with slopes exceeding ±30% of the batch average are classified as abnormal. The screening coverage of this method can reach over 98%, with a single-chip test time of < 200ms.